
Master Volume Analysis: How to Confirm Price Movements in the stock market. Learn to spot real breakouts from fake ones in NIFTY & Sensex with our expert guide.
Introduction
First of all you have to understand that why stocks rises by 5% in early morning and get down or crashed in evening ? Did you know that the price is only half the story, and the “real” truth is hidden in the bars at the bottom of your chart?
Volume Analysis: How to Confirm Price Movements is the secret sauce used by professional traders to separate real market trends from temporary noise. Volume is simply the number of shares traded during a specific time. If the price is the “message,” Volume is the “conviction” behind that message.
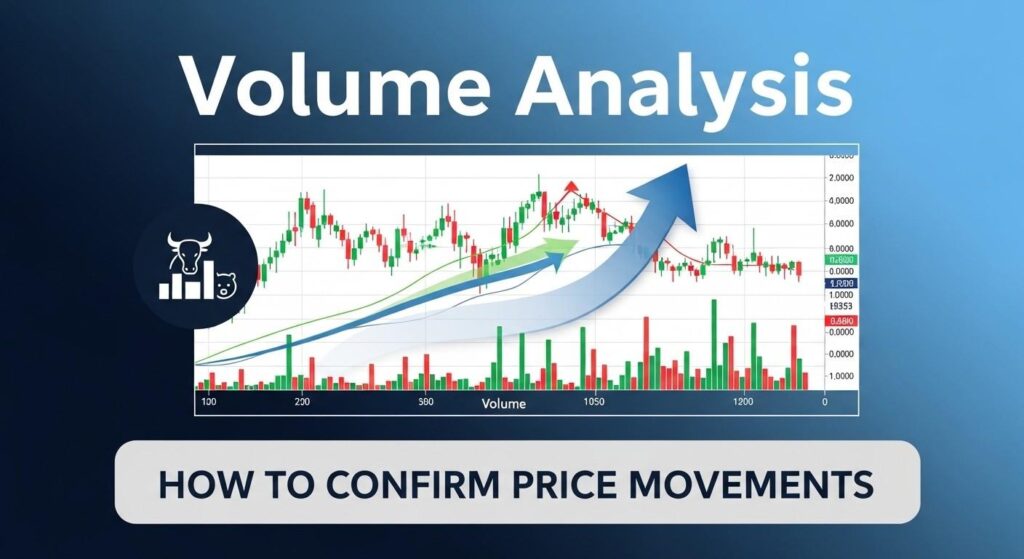
In this article, you will learn how to read these hidden signals, why Volume is crucial for Indian stocks like Reliance or Zomato, and a step-by-step method to use Volume to validate your trades.
What is Volume Analysis: How to Confirm Price Movements?
For beginners, imagine you are at the Jaunpur Sabzi Mandi. If one person shouts that “Aloo ka daam badh gaya,” no one cares. But if 500 people start buying Aloo at a higher price, you know the price rise is real.
In the stock market:
- Volume is the total number of shares that changed hands between buyers and sellers.
- High Volume means a lot of interest and big money (Institutions) are involved.
- Low Volume means very few people are trading, and the price move might be a “fake-out.”
Volume Analysis: How to Confirm Price Movements helps you see if the “Big Boys” (FIIs and DIIs) are buying with you or if you are being trapped in a weak rally.
Why Volume Analysis: How to Confirm Price Movements Matters for Traders (India Context)
In the Indian market, especially with the rise of retail participation in NIFTY and Bank NIFTY, understanding Volume is a life-saver.
- Spotting Institutional Activity: In India, big players like LIC or Mutual Funds trade in huge quantities. Their entry creates “Volume Spikes.” By tracking these, you can follow the smart money.
- Confirming Breakouts: Many Indian traders lose money in “False Breakouts.” If a stock like Infosys breaks its resistance level but the Volume is low, it’s a warning sign that the breakout might fail.
- Liquidity Check: For small-cap Indian stocks, Volume Analysis tells you if you can easily sell your shares later. Low volume stocks can trap your capital.
How to Use Volume Analysis: How to Confirm Price Movements (Step by Step)
Step 1: Add the Volume Indicator
Most charting tools (TradingView, Zerodha, or Groww) have Volume at the bottom by default.
- Look for the vertical bars.
- Green bars usually mean the price closed higher than it opened.
- Red bars mean it closed lower.
Step 2: Look for Price-Volume Relationship
You need to observe how price and volume move together:
- Price Up + Volume Up: This is a Strong Bullish signal. It means people are aggressively buying.
- Price Up + Volume Down: This is a Warning. It means the rally is losing steam.
- Price Down + Volume Up: This is Strong Bearish. It means big players are exiting.
Step 3: Identify Volume Spikes at Support/Resistance
Wait for the price to reach a key level (like a previous high or low).
- If the price breaks a Resistance with a Volume Spike (a bar much taller than the previous 20 bars), it is a high-probability “Buy.”
- If it breaks without Volume, stay away.
Visual Suggestion 1: A chart of Reliance Industries showing a price breakout accompanied by a massive green volume bar. Alt-text: Reliance Price Breakout with High Volume Confirmation.

Common Mistakes to Avoid
- Ignoring the Average: Don’t just look at one bar. Always compare current volume with the 20-period Moving Average of Volume.
- Chasing Every Spike: Sometimes, a huge volume spike happens during news events (like Earnings). This can be “climax volume” where the move is actually ending.
- Using it Alone: Volume tells you “Strength,” but it doesn’t tell you “Direction” on its own. Always use it with price action (Support/Resistance).
- Forgetting “After-Market” Orders: In India, big block deals often happen that can skew volume data. Check for “Bulk/Block Deals” on the NSE website for full context.
India vs USA Comparison
Trading behavior differs between the NSE and NYSE due to market structure.
| Feature | Indian Market (NSE) | USA Market (NYSE/NASDAQ) |
| Pre-Market Volume | Very low; mostly ignored by retail. | Significant; sets the tone for the day. |
| Volume Sources | Centralized (NSE provides total volume). | Fragmented (Volume comes from different exchanges/dark pools). |
| Closing Volume | Huge spike in the last 30 mins (3:00 PM – 3:30 PM). | High volume at “The Close” due to ETF rebalancing. |
Visual Elements Description
Image 1: A simple infographic showing the 4 stages of Price-Volume relationship (Bullish, Weak Bullish, Bearish, Weak Bearish). Alt-text: Price Volume Analysis Matrix.

Image 2: A comparison screenshot showing a “Fake Breakout” (Low Volume) vs “Real Breakout” (High Volume). Alt-text: Confirming Breakouts with Volume Analysis.

Image 3: A screenshot of a “Volume Profile” indicator which shows volume at specific price levels. Alt-text: Volume Profile Indicator for Support and Resistance.

Actionable Tips
- Tip 1: The “Big Bar” Rule. Only trust a breakout if the volume bar is at least 2 times higher than the average of the last 10 days.
- Tip 2: Watch the Pullbacks. In a healthy uptrend, price should go up on high volume and pull back on low volume.
- Tip 3: Check Sector Volume. If NIFTY IT is rising with high volume, individual stocks like TCS or Wipro are more likely to succeed.
- Tip 4: Use Volume SMA. Add a 20-period Simple Moving Average (SMA) to your volume indicator to easily see if volume is “above average.”
- Tip 5: Divergence Alert. If price makes a new high but volume makes a lower high, start tightening your stop-loss; a reversal is coming.
Q1: Does volume include both buying and selling?
Answer: Yes. For every buyer, there is a seller. A green volume bar simply means the net result of all those trades pushed the price up for that period.
Q2: What is “Delivery Volume” in the Indian context?
Answer: In India, NSE provides “Delivery Volume,” which shows shares actually moved to Demat accounts. High delivery % (above 50-60%) indicates long-term buying.
Q3: Can I use volume for Intraday trading?
Answer: Absolutely. Intraday traders use volume to confirm if a “Morning Range Breakout” is worth trading.
Q4: Is low volume always bad?
Answer: Not always. Low volume during a price correction (pullback) is actually a good sign, as it shows there is no panic selling.
Q5: Why is volume higher at the market open and close?
Answer: At 9:15 AM, overnight orders are executed. At 3:20 PM, intraday positions are squared off and institutions finalize their day’s trades.
Conclusion
Volume Analysis: How to Confirm Price Movements is like a lie detector for the stock market. It tells you if a move is backed by the “Big Players” or if it’s just a trap for retail investors. By combining Volume with Price Action, you significantly improve your trading accuracy.
Which strategy will you try first: spotting institutional spikes or avoiding low-volume breakouts? Comment below!
- Business Loan Eligibility and important Documents

- Startup Loan Schemes 2026: भारत सरकार की बेहतरीन योजनाएँ
- MSME Loan कैसे लें? Step-by-Step Guide (2026)
- Health Insurance Claim Process आसान भाषा में – पूरी जानकारी

- Life Insurance vs Term Insurance – कौन बेहतर है?
- Business Insurance क्या है और छोटे व्यापारियों के लिए क्यों ज़रूरी है?