
Learn Fibonacci Retracement: How to Use in Trading to identify support and resistance. Master this tool for NIFTY, Sensex, and US stocks with our step-by-step guide.
Introduction
Ever wondered why stock prices suddenly bounce back after a fall, as if they hit an invisible floor? Did you know that nature’s secret code—the Golden Ratio—can actually help you predict these turning points in the stock market?
Fibonacci Retracement: How to Use in Trading is a powerful technique that helps traders identify potential support and resistance levels based on mathematical percentages. In simple terms, when a stock moves up, it doesn’t go in a straight line; it takes a “breather” or pulls back. This tool tells you exactly where that breather might end.
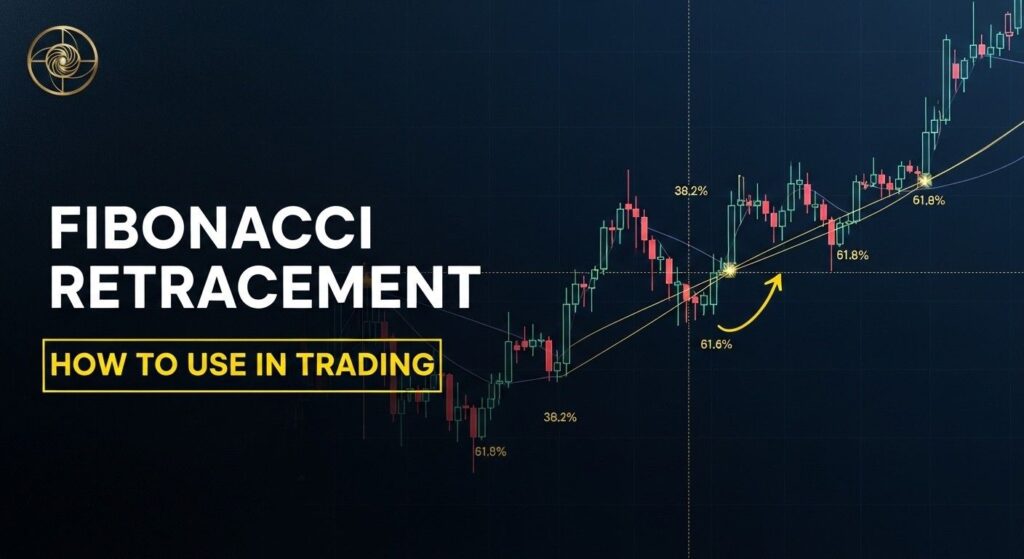
In this comprehensive guide, you will learn the basics of Fibonacci levels, why Indian traders love this tool for NIFTY, and a step-by-step process to apply it to your charts today.
What is Fibonacci Retracement: How to Use in Trading?
For beginners, think of Fibonacci Retracement as a “Market Ruler.” It is based on a sequence of numbers (0, 1, 1, 2, 3, 5, 8, 13…) discovered by an Italian mathematician named Leonardo Fibonacci.
In trading, we use specific percentages derived from these numbers: 23.6%, 38.2%, 50%, 61.8%, and 78.6%.
- The Pullback Logic: Imagine a stock jumps from ₹100 to ₹200. It is unlikely to stay at ₹200 forever. It will drop slightly as people book profits.
- The Retracement: The Fibonacci tool draws horizontal lines on your chart at these percentage levels to show where the stock might stop falling and start rising again.
- The Golden Ratio: The 61.8% level is considered the “Golden Ratio.” Most professional traders believe this is the strongest level where a trend reversal is likely.
Why Fibonacci Retracement Matters for Traders (India Context)
In the Indian market, volatility is high. Whether you are trading NIFTY 50, Sensex, or blue-chip stocks like Reliance and HDFC Bank, price action often follows historical patterns.
- Respecting Levels: Indian institutional investors (DIIs) and retail traders heavily use technical analysis. When thousands of traders look at the same 50% Fibonacci level on a NIFTY chart, it becomes a self-fulfilling prophecy.
- IPO Pullbacks: Often, after a bumper IPO listing (like Tata Technologies or LIC), the stock sees a correction. Using Fibonacci helps Indian investors understand if the fall is a “crash” or just a “healthy retracement” before the next big move.
How to Use Fibonacci Retracement: How to Use in Trading (Step by Step)
Step 1: Identify the Trend
You cannot use Fibonacci on a sideways (flat) market. You need a clear Impulse Move—either a strong move up or a strong move down.
- Find the Swing Low (the starting point of the move).
- Find the Swing High (the peak before the price started dropping).
Step 2: Draw the Tool
Open your charting software (like TradingView or Zerodha Kite). Select the ‘Fibonacci Retracement’ tool.
- In an Uptrend: Click on the Swing Low and drag the cursor up to the Swing High.
- In a Downtrend: Click on the Swing High and drag it down to the Swing Low.
- Lines will automatically appear on your screen at the key percentage levels.
Step 3: Monitor the “Killer Combo” Zones
Look for the price to touch the 50% or 61.8% levels.
- If the price hits 61.8% and forms a bullish candle (like a Hammer), it’s a strong “Buy” signal.
- Confirmation: Never trade Fibonacci alone. Check if the Fibonacci level aligns with a previous support zone or a Moving Average.

Visual Suggestion 1: A screenshot of a NIFTY 50 daily chart showing a move from a low point to a high point with Fibonacci levels overlaid. Alt-text: NIFTY 50 Fibonacci Retracement Levels Example.
Common Mistakes to Avoid
Even the best tools fail if used incorrectly. Here are the pitfalls to watch out for:
- Using it on Short Timeframes: Fibonacci works best on Daily or Hourly charts. On a 1-minute chart, there is too much “noise,” making the levels unreliable.
- Ignoring the Overall Trend: Don’t try to “Buy the Dip” using Fibonacci if the overall market news is extremely negative (e.g., a global crash).
- Being Rigid: Levels are zones, not exact numbers. If the level is at ₹500, the stock might bounce from ₹502 or ₹498. Give it some room.
- Trading Without Stop-Loss: Just because a stock hits the 61.8% level doesn’t mean it must bounce. Always keep a stop-loss below the next Fibonacci level.
India vs USA Comparison
While the math remains the same, the application varies slightly due to market hours and liquidity.
| Feature | Indian Market (NSE/BSE) | USA Market (NYSE/NASDAQ) |
| Volatility | High; levels are often “wicked” or overshot. | High liquidity leads to cleaner touches of levels. |
| Timeframes | Daily/Weekly charts are highly respected. | Intraday (5-15 min) Fibonacci is very popular for scalp trading. |
| Gaps | Frequent overnight gaps due to global cues. | Massive gaps during “Earnings Season” can skip Fib levels. |
Visual Elements Description
- Image 1: Basic diagram showing the Fibonacci sequence and how percentages are calculated. Alt-text: Fibonacci Sequence Math for Trading.

- Image 2: A comparison chart showing a “Success” vs “Failure” Fibonacci trade. Alt-text: Fibonacci Buy Signal vs False Breakout.

- Image 3: A table showing the 5 key Fibonacci levels and their “Strength Rating” (e.g., 61.8% = High Strength). Alt-text: Fibonacci Levels Strength Chart.

Actionable Tips
- Tip 1: Use the 50% Rule. While not a pure Fibonacci number, the 50% retracement is a psychological level where many Indian stocks bounce.
- Tip 2: Combine with Candlesticks. Only enter a trade when a Bullish/Bearish candle forms on the Fibonacci line.
- Tip 3: Practice on Paper. Before using real money, draw Fib levels on 10 old charts of Reliance or Infosys to see how they worked.
- Tip 4: Look for Confluence. If a Fib level and a 200-day Moving Average meet at the same price, it is a high-probability trade.
- Tip 5: Update your Highs. If the stock makes a new high, you must redraw your Fibonacci tool from the same low to the new high.
Q1: Is Fibonacci Retracement 100% accurate?
Answer:- No, no tool in trading is 100% accurate. It is a probability tool. It works best when combined with other indicators like Volume or RSI.
Q2: Which Fibonacci level is most important?
Answer:- The 61.8% level, often called the Golden Ratio, is considered the most critical level for a trend reversal.
Q3: Can I use Fibonacci for Intraday trading?
Answer:- Yes, you can use it on 15-minute or 30-minute charts, but be aware that intraday volatility can sometimes break these levels temporarily.
Q4: Do I need to calculate these numbers manually?
Answer:- No. Modern platforms like Zerodha, Upstox, or TradingView have built-in tools that do the math for you automatically.
Q5: Does Fibonacci work in a falling market?
Answer:- Yes. In a downtrend, you can use it to find “Resistance” levels to see where the stock might stop its temporary rally and start falling again.
Conclusion
Mastering Fibonacci Retracement: How to Use in Trading can transform you from a confused beginner into a strategic trader. By identifying where the “Smart Money” is likely to buy the dip, you increase your chances of success in the Indian and USA, UK markets. Remember, patience is key—wait for the price to come to your levels rather than chasing the stock.
Note:- with my honest Openion The Fibonacci retracement is a powerfull indicator for Indian, USA, UK stock market. your wait for stock proce come to your fibonacci Retracement level then start your buying your stockes.