
Learn Chart Patterns like Head and Shoulders & Double Top/Bottom with examples. Improve your trading strategy with this beginner-friendly guide.
INTRODUCTION
Did you know that most market reversals leave clear footprints on charts before they happen? Many traders miss these signals simply because they don’t understand chart patterns.
Chart Patterns:-
Head and Shoulders, Double Top/Bottom- are among the most powerful tools used by traders to predict trend reversals. These patterns help you identify when a stock might change direction—before it actually happens.
In this article, you’ll learn what these patterns are, why they matter in the Indian stock market, and how you can use them step by step. By the end, you’ll be able to spot these patterns confidently and improve your trading decisions.
What is Chart Patterns: Head and Shoulders, Double Top/Bottom
Chart patterns are visual formations created by price movements on a stock chart. They reflect market psychology—how buyers and sellers behave at different levels.
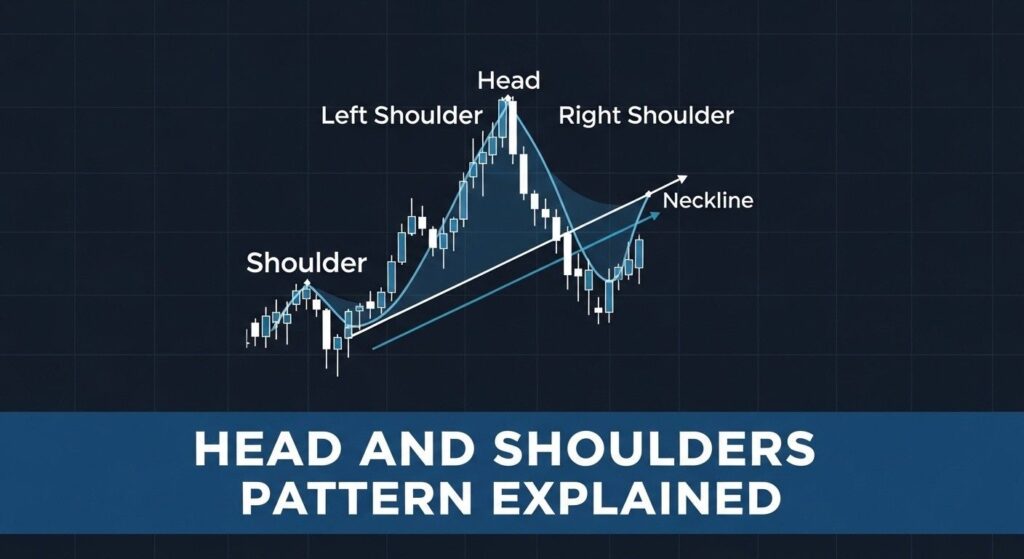
1. Head and Shoulders Pattern:- This is a trend reversal pattern that appears after an uptrend.
Structure:
- Left Shoulder (first peak)
- Head (higher peak)
- Right Shoulder (lower peak)
- Neckline (support level)
Important
When price breaks the neckline, it signals a downtrend reversal.
2. Double Top Pattern
This pattern forms when price hits a resistance level twice and fails to break it.
Indicates:
- Strong resistance
- Possible downward reversal
3. Double Bottom Pattern
Opposite of Double Top.
Structure:
- Two lows at similar level
- Breakout above resistance
Signals a bullish reversal
Why Chart Patterns: Head and Shoulders, Double Top/Bottom Matters for Traders (India Context)
In the Indian market, these patterns work very well due to high retail participation and emotional trading.
Example from Indian Market:
- NIFTY 50 often forms Double Top during resistance zones
- Bank Nifty frequently shows Head and Shoulders before corrections
- Stocks like Reliance, TCS show clear reversal patterns on daily charts
Why You Should Care:
- Helps identify entry and exit points
- Reduces emotional trading
- Works well in both intraday and swing trading
- Useful in volatile markets like India
Note:- In India, news and sentiment move markets fast—these patterns help you stay ahead.
How to Use Chart Patterns: Head and Shoulders, Double Top/Bottom (Step by Step)
Step 1: Identify the Trend
Before spotting patterns, check the trend.
- Use moving averages (20 EMA, 50 EMA)
- Look at higher highs & higher lows
- Confirm if market is trending or sideways
Important:
- Head and Shoulders = after uptrend
- Double Bottom = after downtrend
Screenshot Suggestion:
Chart showing clear uptrend before pattern formation
Alt Text: “Uptrend before Head and Shoulders pattern”
Step 2: Spot the Pattern Formation
Now observe price structure carefully.
For Head and Shoulders:
- First peak (Left shoulder)
- Higher peak (Head)
- Lower peak (Right shoulder)
- Draw neckline
For Double Top/Bottom:
- Two equal highs or lows
- Clear support/resistance
Note:- Use horizontal lines to mark levels.
Key Tip:
- Pattern should be clear and visible
- Avoid forcing patterns
Screenshot Suggestion:
Labeled Head and Shoulders pattern
Alt Text: “Head and Shoulders pattern with neckline”
Step 3: Wait for Breakout Confirmation
Never trade before confirmation.
- Wait for price to break neckline/support
- Volume should increase
- Candle should close beyond level
Entry Strategy:
- Enter after breakout
- Or wait for retest (safer option)
Example:
- Double Top → Sell below support
- Double Bottom → Buy above resistance
Screenshot Suggestion:
Breakout candle with volume spike
Alt Text: “Breakout confirmation with high volume”

Step 4: Set Stop Loss and Target
Risk management is key.
Stop Loss:
- Head and Shoulders → above right shoulder
- Double Top → above resistance
- Double Bottom → below support
Target Calculation:
- Measure pattern height
- Apply same distance after breakout
Example:
If pattern height = 50 points
Target = 50 points from breakout
Step 5: Combine with Indicators
Patterns alone are not enough.
Use:
- RSI (for overbought/oversold)
- MACD (trend confirmation)
- Volume analysis
This increases accuracy.
Common Mistakes to Avoid
1. Trading Without Confirmation
Many beginners enter early.
Always wait for breakout.
2. Ignoring Volume
Patterns without volume are weak.
Look for volume spike.
3. Forcing Patterns
Not every shape is a pattern.
Trade only clear setups.
4. No Stop Loss
Leads to heavy losses.
Always define risk.
5. Ignoring Market Trend
Pattern works better with trend context.
Check higher timeframe.
India vs USA Comparison
| Factor | India Market | USA Market |
|---|---|---|
| Volatility | High | Moderate |
| Retail Participation | Very High | Moderate |
| Pattern Reliability | Good in short term | Better in long term |
| News Impact | Immediate | Gradual |
| Timeframes | Intraday & Swing | Swing & Position |
👉 In India, patterns work faster but need quick decisions.
VISUAL ELEMENTS
Image 1:
Head and Shoulders structure diagram
Alt Text: “Head and Shoulders chart pattern explained”
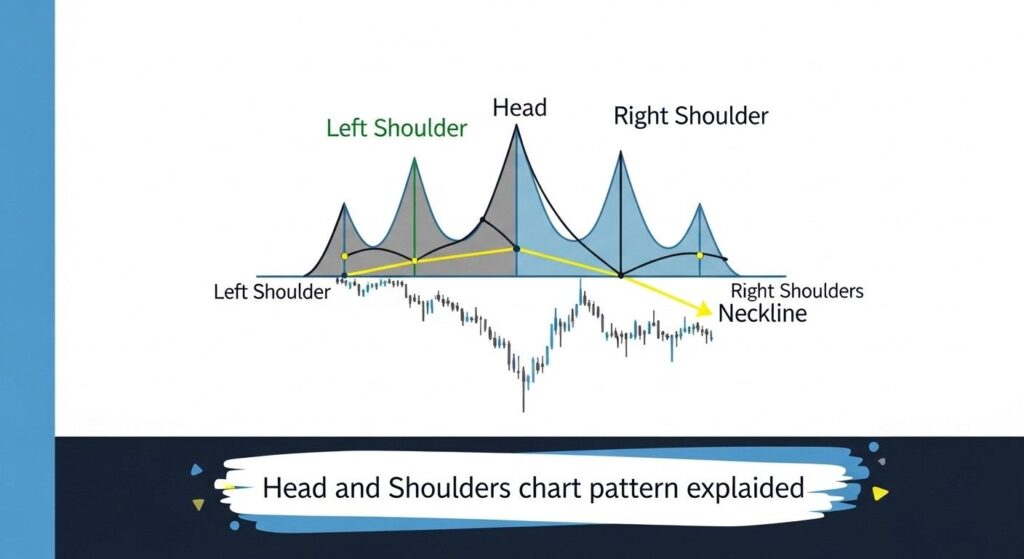
Image 2:
Double Top vs Double Bottom comparison chart
Alt Text: “Double Top and Double Bottom patterns”
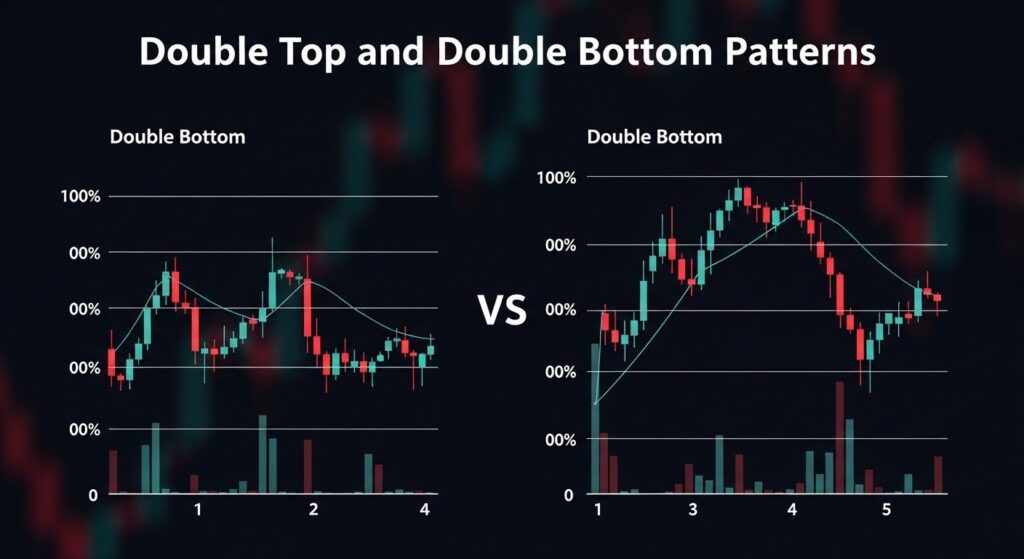
Image 3:
Breakout with volume example
Alt Text: “Chart breakout with volume confirmation”
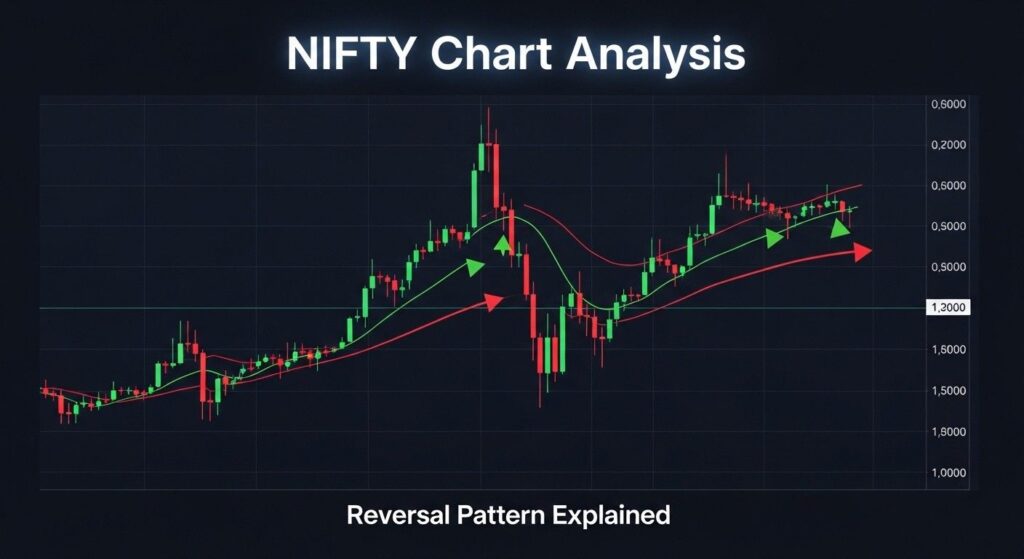
Image 4:
Real NIFTY chart example
Alt Text: “NIFTY chart showing reversal pattern”
ACTIONABLE TIPS
- Always wait for breakout – Early entry increases risk
- Use higher timeframe– Daily charts are more reliable
- Combine with RSI – Avoid false signals
- Trade only clear patterns – Clarity = confidence
- Follow risk management – Never risk more than 2% per trade
Q1: Are chart patterns reliable for beginners?
Yes, especially Head and Shoulders and Double Top/Bottom are beginner-friendly. But you should always confirm with volume and indicators.
Q2: Which timeframe is best for these patterns?
Daily and 4-hour charts are best for beginners. Intraday patterns are faster but riskier.
Q3: Can I use these patterns in intraday trading?
Yes, but use strict stop loss and confirmation. Intraday markets are more volatile.
Q4: Do these patterns work in all stocks?
They work better in liquid stocks like NIFTY 50 stocks. Avoid low-volume stocks.
Q5: What is the success rate of these patterns?
With proper confirmation, success rate can be around 60–70%.
CONCLUSION
Chart Patterns: Head and Shoulders, Double Top/Bottom are powerful tools that help you identify market reversals early. If you combine them with proper confirmation, volume analysis, and risk management, they can significantly improve your trading accuracy.
Start by practicing on charts, identify patterns, and test your strategy before real trading.