Introduction
Did you know that a single line on your trading chart can tell you whether the market is in an uptrend or downtrend — and even warn you before a big move? That line is called a moving average, and the moving average strategy for beginners is one of the easiest ways to start trading profitably.
In this article, you will learn exactly what the moving average strategy is, why it works so well in the Indian stock market, and how to use the moving average strategy for beginners step by step. You will see real examples from Nifty 50, Sensex, and popular stocks like Reliance and HDFC Bank.
Whether you trade intraday on Bank Nifty or invest long-term, this strategy will help you cut through market noise, time your entries better, and protect your capital. You will also get 5 actionable tips, common mistakes to avoid, an India vs USA comparison, and answers to the questions every beginner asks. By the end, you will be able to apply this strategy on any chart in minutes.
What is the Moving Average Strategy for Beginners? (For Beginners)
A moving average is simply the average price of a stock or index over a specific number of days. It smooths out daily price ups and downs so you can see the real trend.
There are two main types you need to know:
- Simple Moving Average (SMA): Adds up the closing prices for “X” days and divides by “X”. It treats every day equally.
- Exponential Moving Average (EMA): Gives more weight to recent prices. It reacts faster to new price moves.
The moving average strategy uses these lines to:
- Identify the overall trend (price above moving average = uptrend)
- Spot buy and sell signals when two averages cross each other
- Act as dynamic support or resistance levels
Beginners love it because there is almost no guesswork. You do not need to predict the market — you simply follow what the averages are telling you.
Why Moving Average Strategy for Beginners Matters for Traders (India Context)
Indian markets are fast-moving and full of retail traders, FII flows, and sudden news events. A moving average strategy for beginners helps you stay on the right side of the trend instead of getting chopped up by daily noise.
Real Indian examples
- In 2023-2024, Nifty 50 respected its 200-day SMA as strong support during pullbacks. Traders who bought when price stayed above this line captured the next leg up.
- The 50-day SMA crossing above the 200-day SMA (called Golden Cross) has repeatedly signalled strong bull runs in Sensex and Nifty.
- Stocks like Reliance Industries and HDFC Bank show crystal-clear moving average crossovers because of high volume and institutional participation.
This strategy works especially well in India because:
- It filters out fake breakouts caused by retail frenzy
- It gives clear rules for stop-loss (below the moving average)
- It works on Nifty, Bank Nifty, and individual stocks
- You can use it for both delivery trading and options
Traders who master this simple tool make fewer emotional decisions and let winners run longer.
How to Use the Moving Average Strategy for Beginners (Step by Step)
Here is a clear 5-step process you can follow today on TradingView, Zerodha Kite, or Groww.
Step 1: Choose Your Moving Averages
Start with the most popular combinations for beginners:
- Trend identification: 200-day SMA or EMA
- Medium-term: 50-day SMA or EMA
- Short-term (intraday): 9-day and 21-day EMA
Why these numbers? They are widely watched by institutions, so they become self-fulfilling.
Pro tip: Use SMA for long-term investing and EMA for swing or intraday trading because EMA reacts faster.
Step 2: Plot the Averages on Your Chart
- Open the chart of Nifty 50 or your favourite stock
- Add two or three moving averages (never more than three at once)
- Use daily timeframe for beginners; switch to 15-minute for intraday
[Image 1: Nifty 50 daily chart showing 50-day and 200-day SMA with clear Golden Cross] Alt text: Nifty 50 daily chart highlighting 50 SMA crossing above 200 SMA (Golden Cross) with trend direction marked
Step 3: Identify the Trend and Buy/Sell Signals
- Uptrend signal: Price stays above the moving average
- Downtrend signal: Price stays below the moving average
- Golden Cross (buy): Shorter MA crosses above longer MA
- Death Cross (sell): Shorter MA crosses below longer MA
Wait for the candle to close above or below the average before taking action.
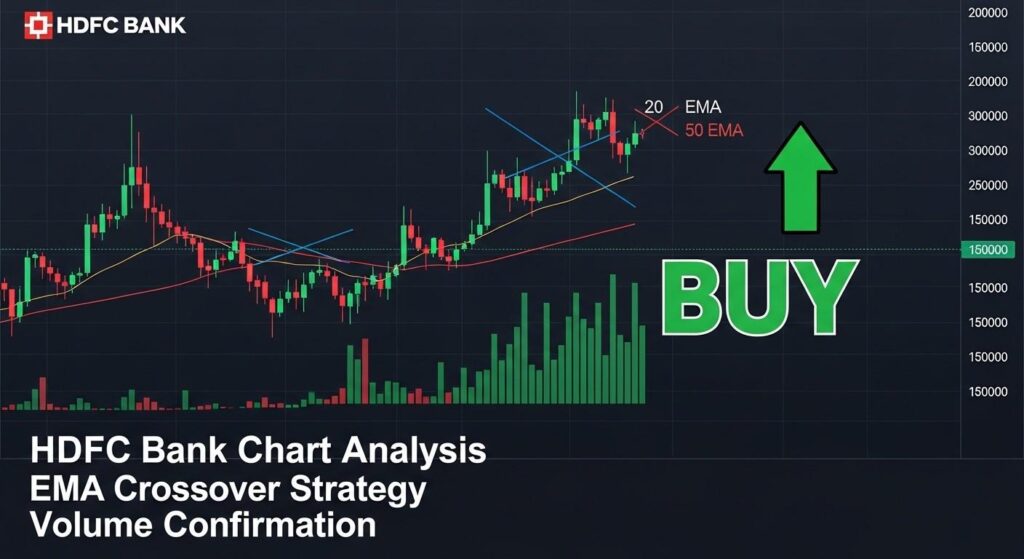
Step 4: Add Volume and Confirmation
Strong signals always come with:
- Rising volume on the crossover day
- Bullish candlestick patterns at support (the moving average line)
- Price pulling back to the moving average and bouncing (dynamic support)
Rule: Never trade a crossover on low volume — it often fails.
[Image 2: HDFC Bank chart with 20 EMA and 50 EMA crossover plus volume confirmation] Alt text: HDFC Bank daily chart showing EMA crossover with volume spike and buy signal
Step 5: Set Stop-Loss and Target
- Place stop-loss just below the longer moving average
- Use 1:2 risk-reward ratio minimum
- Exit when price closes below the shorter moving average in an uptrend
[Image 3: Bank Nifty 15-minute chart with step-by-step moving average signals marked] Alt text: Step-by-step Bank Nifty intraday chart demonstrating full moving average strategy entry, stop-loss, and exit

[Image 4: Side-by-side comparison of SMA vs EMA on Reliance Industries chart] Alt text: Reliance Industries chart comparing Simple Moving Average and Exponential Moving Average response speed.

Common Mistakes to Avoid
- Mistake 1: Using too many moving averages at once Your chart becomes a mess of lines and you get confused. Fix: Stick to maximum two or three averages.
- Mistake 2: Trading every single crossover Beginners jump on every cross and lose money on whipsaws. Fix: Wait for volume confirmation and higher-timeframe alignment.
- Mistake 3: Ignoring the overall market trend You buy a Golden Cross in a strong bear market. Fix: Always check the 200-day moving average first.
- Mistake 4: Using the same periods for every stock A volatile small-cap needs shorter averages than Nifty. Fix: Test 9/21 for intraday and 50/200 for positional trades.
- Mistake 5: Forgetting to adjust for news events RBI policy or Budget can break through moving averages easily. Fix: Check the economic calendar before big trades.
India vs USA Comparison
| Aspect | Indian Markets (NSE/BSE) | US Markets (NYSE/NASDAQ) |
|---|---|---|
| Best Timeframes | Daily for positional, 15-min for intraday | Daily/Weekly for long-term, 5-min for day trading |
| Popular Combinations | 9/21 EMA (intraday), 50/200 SMA (positional) | 50/200 SMA (very popular), 20/50 EMA |
| Market Volatility | Higher — shorter EMAs work better | Lower — longer SMAs reduce false signals |
| Major Influence | FII/DII flows, RBI policy, earnings | Fed decisions, quarterly earnings |
| Confirmation Tools | Volume + Open Interest (options) | Volume + Options flow data |
| Retail Participation | Very high — moving averages become self-fulfilling | Institutional heavy — algorithms respect MAs |
The core rules of the moving average strategy remain identical, but Indian traders benefit from adding volume and event awareness.
Actionable Tips You Can Implement Today
- Tip 1: Open Nifty 50 daily chart and add 50-day and 200-day SMA right now — you will instantly see the current trend.
- Tip 2: Switch to EMA when trading Bank Nifty options because it reacts faster to price swings.
- Tip 3: Always check if price is above or below the 200-day moving average before taking any positional trade.
- Tip 4: Mark the moving average as a stop-loss zone instead of a fixed rupee amount — it adapts to volatility.
- Tip 5: Backtest the strategy on any 10 past charts of your favourite stock before using real money.
Question 1: What is the Golden Cross in moving average strategy?
The Golden Cross happens when the 50-day moving average crosses above the 200-day moving average. It is considered a strong bullish signal and often marks the start of a major uptrend in Nifty or Sensex. Many big rallies in Indian markets have started after a Golden Cross.
Question 2: Should beginners use SMA or EMA?
Use SMA if you are doing long-term investing because it is smoother. Choose EMA for swing or intraday trading because it responds faster to recent price action. Start with SMA until you feel comfortable.
Question 3: Can I use moving average strategy for intraday trading in India?
Yes! On 15-minute or 5-minute charts, the 9 EMA and 21 EMA work very well for Nifty and Bank Nifty. Combine with volume for high-probability entries and always keep tight stop-losses.
Question 4: How many moving averages should I use on one chart?
Beginners should use only two. Once you gain experience, you can add a third. Too many lines create confusion and lead to analysis paralysis.
Question 5: Does the moving average strategy work in sideways markets?
It works less effectively in sideways markets because you will get many false crossovers. The best solution is to avoid trading or switch to range-bound strategies like support and resistance until a clear trend appears.
Conclusion
The moving average strategy for beginners is powerful because it turns complicated price action into simple, easy-to-follow rules. You now know how to spot trends, catch Golden Cross signals, and protect your trades with dynamic stop-losses.
Start small. Pick Nifty 50 or one stock you already like, apply the five steps, and watch how the averages guide you.