Introduction
Did you know that one simple indicator can tell you when a stock is “too expensive” and likely to fall, or “too cheap” and ready to bounce — often before the crowd notices? That tool is the RSI indicator, and learning RSI indicator overbought and oversold signals is one of the fastest ways for beginners to improve their trading results.
In this article, you will discover exactly what the RSI indicator is, why it works so well in the Indian stock market, and how to use the RSI indicator for overbought and oversold signals step by step. You will see real examples from Nifty 50, Sensex, and popular stocks like Reliance and HDFC Bank.
Whether you trade intraday on Bank Nifty or hold stocks for weeks, this momentum tool will help you avoid buying at the top and selling at the bottom. You will also get 5 actionable tips, common mistakes to avoid, an India vs USA comparison, and answers to the questions every beginner asks. By the end, you will be able to read RSI signals on any chart in under 30 seconds.
What is the RSI Indicator: Overbought and Oversold Signals? (For Beginners)
The Relative Strength Index (RSI) is a momentum oscillator that measures how fast and how strongly prices have been moving. It runs on a scale from 0 to 100.
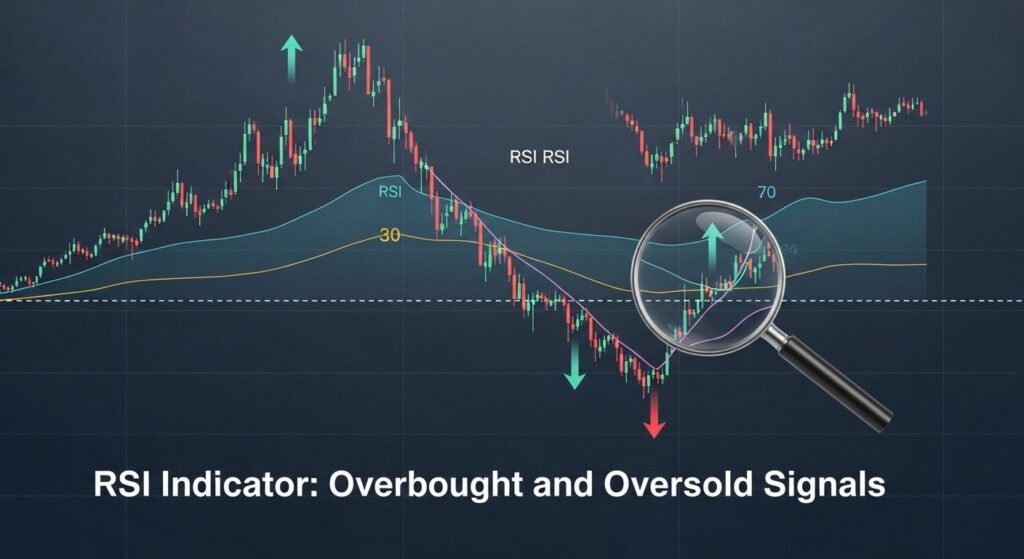
- Overbought (above 70): The stock has risen too quickly and may be due for a pause or pullback.
- Oversold (below 30): The stock has fallen too sharply and may be ready for a bounce.
Think of RSI like a speedometer for the market. When the speedometer shows “too fast” (over 70), the car (price) usually slows down. When it shows “too slow” (under 30), the car usually speeds up again.
The standard setting is 14 periods (14 days on daily charts or 14 candles on lower timeframes). You can adjust it, but 14 is the most reliable starting point for beginners. RSI works on every timeframe — daily, weekly, hourly, or even 5-minute charts.
Why RSI Indicator Overbought and Oversold Signals Matter for Traders (India Context)
Indian markets move fast because of high retail participation, FII inflows, and frequent news events. The RSI indicator overbought and oversold signals give you an early warning system that helps you stay away from emotional mistakes.
Real Indian examples
- During the March 2020 COVID crash, Nifty’s RSI dropped below 20 (deeply oversold). Traders who bought in this zone caught one of the strongest recoveries in Indian market history.
- In late 2023 and early 2024, when Nifty repeatedly crossed 22,000, the RSI hit overbought levels above 75 several times, warning of short-term corrections that actually happened.
- Stocks like HDFC Bank and TCS often show clear oversold bounces on the daily chart during earnings-season dips, giving retail traders high-probability entry points.
This strategy matters in India because:
- It works beautifully with high-volume stocks on NSE
- It helps you time entries in volatile sectors like IT, banking, and auto
- It reduces the risk of buying during FII-driven rallies that are about to reverse
- You can combine it with Nifty options and Bank Nifty futures for precise trades
Once you learn to read these signals, you will trade with more confidence and fewer losses.
How to Use the RSI Indicator for Overbought and Oversold Signals (Step by Step)
Follow this simple 5-step process on TradingView, Zerodha Kite, or Groww.
Step 1: Add RSI to Your Chart
- Open the chart of Nifty 50, Bank Nifty, or any stock
- Click “Indicators” and search for “RSI”
- Keep the default setting: 14 periods and close price
Pro tip: Place the RSI panel below the price chart so you can see both together.
[Image 1: Nifty 50 daily chart with RSI panel showing standard 14-period setting and 70/30 lines] Alt text: Nifty 50 daily chart with RSI indicator highlighting overbought (above 70) and oversold (below 30) zones
Step 2: Understand the Key Levels
- Above 70 = Overbought zone → potential sell or exit signal
- Below 30 = Oversold zone → potential buy or entry signal
- Around 50 = Neutral zone (no strong signal)
In strong uptrends (like 2024 Nifty rally), RSI can stay above 60 for weeks. In downtrends, it can stay below 40. So always look at the bigger picture.
Step 3: Spot the Basic Signals
- Buy signal: RSI rises above 30 after being oversold
- Sell signal: RSI falls below 70 after being overbought
- Wait for the candle to close before acting — never trade while the RSI is still moving.
Step 4: Confirm with Divergence (Powerful Extra Signal)
Divergence happens when price and RSI move in opposite directions:
- Bullish divergence: Price makes lower low but RSI makes higher low → strong buy
- Bearish divergence: Price makes higher high but RSI makes lower high → strong sell
This is one of the most reliable signals in the Indian market.
[Image 2: HDFC Bank chart showing bullish RSI divergence at oversold level] Alt text: HDFC Bank daily chart with clear bullish RSI divergence and oversold bounce example
Step 5: Combine with Other Tools & Manage Trade
Never use RSI alone. Always confirm with:
- Volume spike
- Candlestick patterns (hammer at oversold, shooting star at overbought)
- Support/resistance levels or moving averages
Set stop-loss below recent low (for buys) or above recent high (for sells). Aim for minimum 1:2 risk-reward.
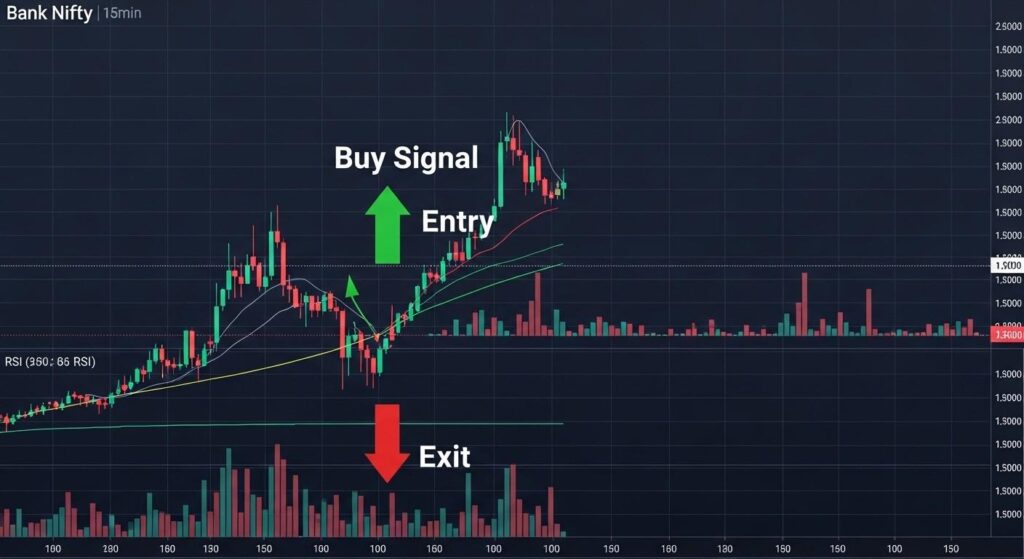
[Image 3: Bank Nifty 15-minute chart with complete RSI buy signal, entry, and exit marked] Alt text: Step-by-step Bank Nifty intraday chart showing RSI oversold signal with confirmation and trade management
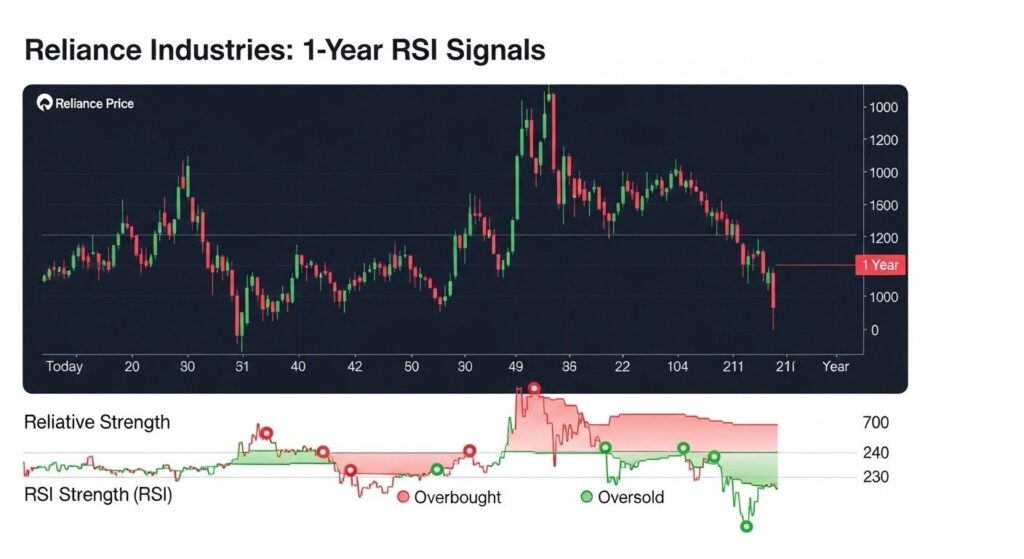
[Image 4: Reliance Industries chart showing both overbought and oversold RSI signals in one year] Alt text: Reliance Industries one-year chart with multiple RSI overbought and oversold signals highlighted
Common Mistakes to Avoid
- Mistake 1: Buying every time RSI goes below 30 In a strong downtrend, RSI can stay oversold for weeks. Fix: Wait for RSI to cross back above 30 + bullish candle confirmation.
- Mistake 2: Ignoring the overall trend You sell when RSI is overbought in a powerful bull market. Fix: Check the 200-day moving average first — trade with the trend.
- Mistake 3: Using RSI alone without confirmation Beginners rely only on the number and get trapped in false signals. Fix: Always combine RSI with volume or candlestick patterns.
- Mistake 4: Using the wrong period for your timeframe 14-period on 5-minute chart behaves differently than on daily. Fix: Use 14 for daily/weekly, 9–11 for intraday.
- Mistake 5: Forgetting upcoming events Budget or RBI announcements can push RSI to extremes instantly. Fix: Check the economic calendar before trading strong signals.
India vs USA Comparison
| Aspect | Indian Markets (NSE/BSE) | US Markets (NYSE/NASDAQ) |
|---|---|---|
| Best RSI Period | 14 is standard; 9–11 for intraday | 14 is standard; 14 works across all timeframes |
| Volatility Effect | Higher — RSI hits extremes more often | Lower — signals are cleaner but less frequent |
| Major Drivers | FII flows, RBI policy, earnings, retail frenzy | Fed decisions, quarterly earnings, macro data |
| Best Confirmation | Volume + OI data (options) + candlesticks | Volume + options chain flow |
| False Signal Frequency | More common in small-caps | Fewer due to institutional dominance |
| Popular Use | Swing + intraday on Nifty/Bank Nifty | Long-term investing + day trading |
The core RSI rules are exactly the same, but Indian traders get better results by adding volume and event awareness.
Actionable Tips You Can Implement Today
- Tip 1: Open Nifty 50 daily chart right now, add 14-period RSI, and note the current reading — you will instantly know if the market is overbought or oversold.
- Tip 2: Look for bullish divergence on any stock you already own — it often gives the best low-risk entry.
- Tip 3: Always pair RSI signals with the nearest support or resistance level for higher accuracy.
- Tip 4: Use RSI on 15-minute charts for Bank Nifty options to catch quick intraday reversals.
- Tip 5: Backtest 10 past charts of your favourite stock using RSI signals before trading with real money.
Question 1: What exactly do overbought and oversold mean on the RSI indicator?
Overbought (above 70) means the asset has risen too fast and may pause or correct. Oversold (below 30) means it has fallen too fast and may bounce. These are warning zones, not automatic buy/sell buttons. Always confirm with other tools.
Question 2: What is the best RSI setting for Indian stocks and Nifty?
The standard 14-period setting works perfectly for most beginners on daily charts. For intraday trading on Bank Nifty or Nifty, try 9 or 11 periods. Start with 14 until you gain experience.
Question 3: Can beginners use the RSI indicator for intraday trading in India?
Yes! On 5-minute or 15-minute charts, RSI gives excellent short-term overbought and oversold signals. Combine it with volume and previous day’s high/low for best results in the Indian market.
Question 4: What is RSI divergence and why is it powerful?
Divergence occurs when price makes a new high/low but RSI does not. Bullish divergence at oversold levels often leads to strong bounces. It is considered one of the most reliable signals in technical analysis.
Question 5: Should I rely only on RSI for trading decisions?
No. RSI works best when combined with moving averages, support/resistance, and candlestick patterns. Using it alone can lead to many false signals, especially in sideways markets.
Conclusion
The RSI indicator overbought and oversold signals give you a clear, objective way to spot potential reversals in any market condition. You now know how to add it to your charts, read the signals, confirm them properly, and avoid the most common beginner mistakes.
Start small. Pick Nifty 50 or one stock you follow, apply the five steps today, and watch how RSI helps you make smarter decisions.