Introduction
Ever wondered why a stock suddenly stops falling and bounces back up, or why it refuses to go higher even when the news looks great? These invisible “walls” are called support and resistance levels — and they appear on almost every chart you look at.
In this article, you will learn exactly what support and resistance levels are, why they work so well in the Indian stock market, and how to identify support and resistance levels step by step. Whether you trade Nifty, Sensex, Bank Nifty, or individual stocks like Reliance, HDFC Bank or TCS, these levels will help you decide when to buy, when to sell, and where to place your stop-loss.
You will also get real Indian market examples, a side-by-side India vs USA comparison, 5 actionable tips you can use today, and answers to the most common questions beginners ask. By the end, you will be able to spot these levels on any chart in under 5 minutes.
What Are Support and Resistance Levels? (For Beginners)
Imagine you are playing a game of tug-of-war.
- Support level is the floor where the buyers (bulls) suddenly become stronger than the sellers and push the price back up.
- Resistance level is the ceiling where the sellers (bears) become stronger and push the price back down.
Support is a price zone where demand is strong enough to stop a downtrend. Resistance is a price zone where supply is strong enough to stop an uptrend.
These are not exact single prices — they are zones. Prices can wiggle a little above or below the level and still respect it.
When price breaks through resistance with strong volume, that level often becomes future support. When price falls through support, it often becomes future resistance. This “role reversal” is one of the most powerful concepts in technical analysis.
Why Support and Resistance Levels Matter for Traders (India Context)
Indian markets are driven by a unique mix of retail investors, FII flows, DII buying, and government policy announcements. Support and resistance levels help you navigate this environment with clarity.
Real Indian examples
- In March 2020, during the COVID crash, Nifty found strong support near 7,500–8,000. The index bounced sharply from this zone even when global markets were in free fall.
- In 2023–2024, Nifty repeatedly respected the 19,000–19,500 zone as resistance before finally breaking out on strong FII buying.
- Stocks like Reliance Industries and HDFC Bank show clear horizontal support and resistance because of high retail participation and round-number psychology.
These levels give you:
- Better entry and exit points
- Precise stop-loss placement
- Early warning of trend reversals
- Reduced emotional trading
Traders who ignore them often buy at the top of a rally or sell at the bottom of a crash — two costly mistakes you can easily avoid.
How to Identify Support and Resistance Levels (Step by Step)
Here is a simple 5-step process you can follow on TradingView, Zerodha Kite, or Groww charts.
Step 1: Choose the Right Time Frame
- Swing traders: Use daily or weekly charts
- Intraday traders: Use 15-minute or 5-minute charts
- Always check the higher time frame first (weekly → daily → hourly)
Why? A support level on the daily chart is far stronger than one on the 5-minute chart.
Tip: Open two charts side by side — one higher time frame, one lower.
Step 2: Mark Swing Highs and Swing Lows
Look for the most obvious peaks and valleys:
- Swing high = highest point where price reversed downward
- Swing low = lowest point where price reversed upward
Rule of thumb: The more times price has bounced from a level, the stronger it is.
Step 3: Draw Horizontal Lines (or Zones)
- Use the “horizontal line” tool
- Draw at the exact price where multiple candles reversed
- Widen it into a zone (10–30 points for Nifty, 0.5–1% for stocks)
Pro tip: Round numbers (19,000, 20,000, ₹2,500) act as magnets in the Indian market.
[Image 1: Nifty daily chart with clear horizontal support and resistance zones marked in different colors] Alt text: Nifty 50 daily chart showing identified support (green) and resistance (red) levels with multiple bounces
Step 4: Confirm with Volume and Candlestick Patterns
Strong levels show:
- High volume at the support or resistance zone
- Bullish engulfing or hammer candles at support
- Bearish engulfing or shooting star at resistance
Low-volume touches are weak and often fail.
Step 5: Watch for Breakout or Breakdown
- Breakout = price closes above resistance on high volume → possible new uptrend
- Breakdown = price closes below support on high volume → possible new downtrend
- Always wait for candle close + volume confirmation before acting.
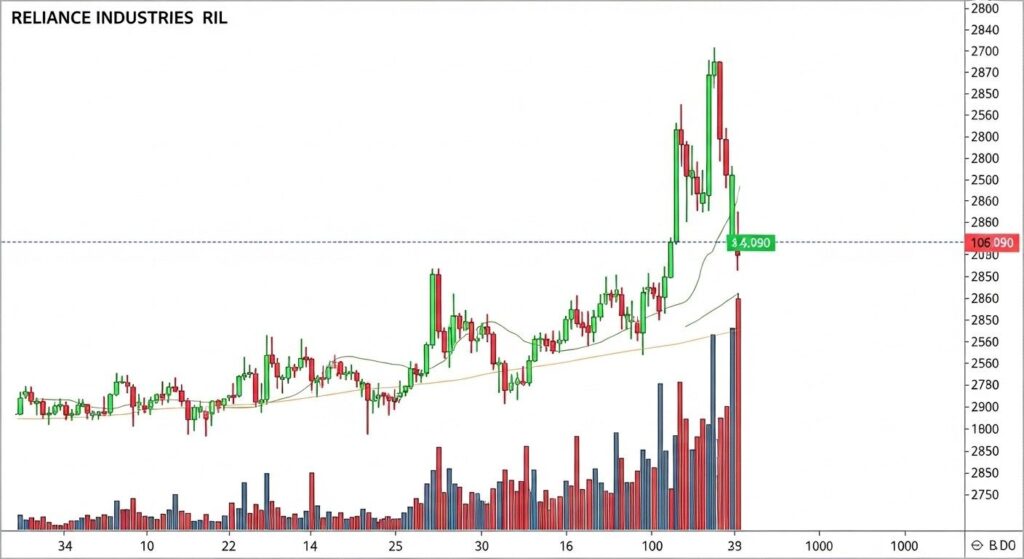
[Image 2: Reliance Industries chart showing breakout above resistance with volume spike] Alt text: Example of resistance breakout on Reliance stock with volume confirmation
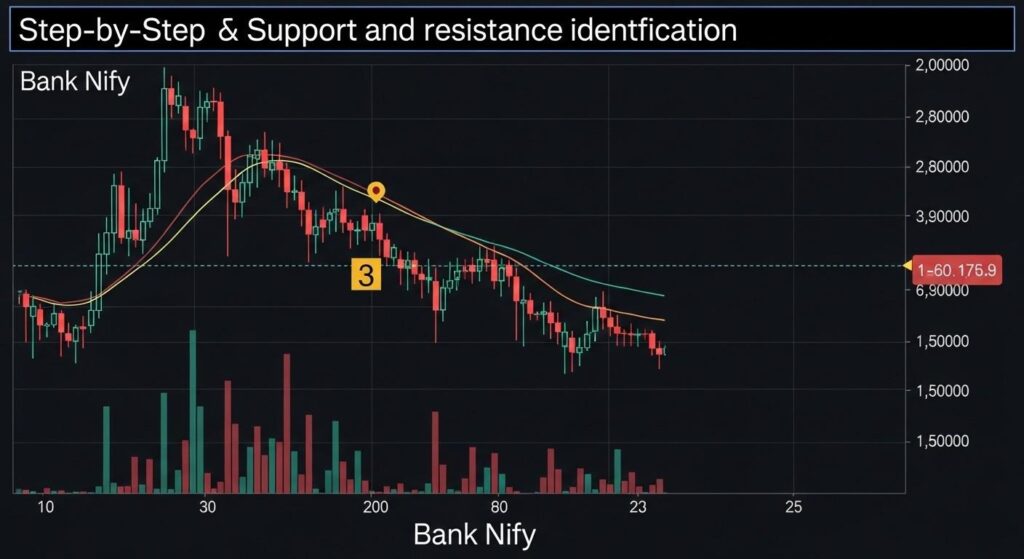
[Image 3: Step-by-step annotated chart showing all five steps on Bank Nifty] Alt text: Bank Nifty chart with step-by-step support and resistance identification process
Common Mistakes to Avoid
- Mistake 1: Treating levels as exact prices instead of zones Prices rarely stop at a single rupee. Always use a 0.5–1% zone. Fix: Draw a rectangle zone instead of a thin line.
- Mistake 2: Drawing too many lines Beginners mark every small wiggle and get confused. Fix: Limit yourself to maximum 3–4 major levels per chart.
- Mistake 3: Ignoring the higher time frame You see support on 15-min chart but it’s actually resistance on daily. Fix: Always start analysis from weekly → daily.
- Mistake 4: Trading the first touch without confirmation Many fake breakouts happen on low volume. Fix: Wait for candle close + volume.
- Mistake 5: Forgetting upcoming events Budget day, RBI policy, or earnings can smash through levels. Fix: Check economic calendar before trading major levels.
India vs USA Comparison
| Aspect | Indian Markets (NSE/BSE) | US Markets (NYSE/NASDAQ) |
|---|---|---|
| Trading Hours | 9:15 AM – 3:30 PM IST (single session) | 9:30 AM – 4:00 PM ET (with pre/post-market) |
| Liquidity | Very high in top 50 stocks, lower in small-caps | Extremely high across most listed stocks |
| Major Drivers | FII/DII flows, Budget, RBI policy, Monsoon | Fed decisions, Earnings, Macro data |
| Round-Number Effect | Extremely strong (19,000, 20,000, ₹2,500) | Strong but less psychological |
| Best Confirmation Tool | Volume + Candlesticks + OI data (for options) | Volume + Options flow + News sentiment |
| Algo Trading Impact | Growing rapidly | Dominant (over 70% of volume) |
The core method of identifying levels remains exactly the same, but Indian traders must pay extra attention to FII data and event risks.
Actionable Tips You Can Implement Today
- Tip 1: Open your favourite stock chart and mark the last three swing highs and lows right now. You will instantly see the major zones.
- Tip 2: Add a 200-day simple moving average — it often acts as dynamic support or resistance in trending markets.
- Tip 3: Use the “Measure” tool to calculate risk-reward before every trade (minimum 1:2).
- Tip 4: Save your marked charts in a “Key Levels” watchlist and review them every weekend.
- Tip 5: Practice on paper trading for 10 charts before using real money. Confidence comes with repetition.
Question 1: What is the difference between support and resistance?
Support is a floor that prevents prices from falling further, while resistance is a ceiling that prevents prices from rising further. When support breaks, it often becomes resistance, and vice versa. This role reversal is a high-probability trading signal.
Question 2: How reliable are support and resistance levels?
They are not 100% accurate but work more than 70% of the time when confirmed with volume and higher time-frame alignment. Always combine them with candlestick patterns and risk management.
Question 3: Can I use support and resistance for intraday trading in India?
Yes! On 15-minute or 5-minute charts, previous day’s high/low and opening range act as powerful levels. Add volume profile for extra confirmation.
Question 4: Which is the best free tool to identify these levels?
TradingView.com is the most popular in India. It offers clean charts, horizontal lines, and public scripts for automatic support/resistance detection.
Question 5: Do support and resistance levels work in options trading?
Absolutely. Option writers often defend major levels (max pain theory), making them even stronger. Check open interest data on NSE to see where big players are positioned.
Conclusion
Support and resistance levels are the foundation of technical analysis. They work because they reflect real human psychology — fear, greed, and memory of past prices. By learning how to identify support and resistance levels, you move from guessing to trading with a clear plan.
Start small. Pick one stock or index today, mark the levels using the 5-step method, and watch how price reacts.